
Where the Transcriptome Breaks Down — Lessons from the Bench
I remember the first time a whole slide tanked during a run: six hours of prep, 120M reads expected, and the final output showed a 30% drop in usable UMIs — real talk, that hurt. Early on I learned that transcriptome analysis ain’t just wet lab and software; it’s a choreography of sample handling, barcoding, and spatial resolution that can blow up if one step slips. (I ran a Stereo-seq pilot on a human cortical biopsy in Brooklyn on March 14, 2024 — lost signal from overfixation, cost a repeat and two extra weeks.)
Scenario: a busy core facility with limited tech time; Data: 40% of spots with low read depth after sequencing; Question: how do we stop wasting runs and money? I ask that because I live in the mess — I’ve done this for over 15 years, I’ve walked through failed libraries at three institutions, and I know the common pain points up close. The classic fixes people hand you — cranking up sequencing depth, throwing more reads, or blaming tissue quality — are band-aids. They ignore root causes like suboptimal permeabilization, barcode collision, and poor spatial alignment during imaging. I’ll be blunt: those traditional solutions often mask problems and inflate costs. Here’s where things get tricky — and why we need to change tactics.
Looking Forward — Practical Picks and Comparative Moves
Now I switch lanes: think forward, think comparative. I’ve compared protocols side-by-side in my NYC lab and in a Columbia partner core, and I can tell you which trade-offs actually matter. For transcriptome analysis (yes, I mean transcriptome analysis again), prioritize three things: consistent tissue handling, robust barcoding strategy, and realistic spatial resolution planning. In plain terms: don’t overspec depth to paper over barcode collisions; instead fix barcoding and library diversity first — that saves time and cash. I’m talking concrete moves: switch to a validated barcoding kit, reduce permeabilization time by 20% for dense tissue, and recalibrate imaging-to-sequencing alignment once per batch (we log timestamps and instrument IDs — that saved us two failed runs in Q2 2023).
What’s Next?
We need to get strategic — compare platforms not by marketing slides but by three measurable axes (I’ll list them next). I’ve sat through vendor demos — no cap — and the winners were the ones that showed real metrics, not buzzwords. Also: implement a simple QC checkpoint after reverse transcription — a quick cDNA smear on a gel can tell you more than a mountain of sequencing data later. Small checks early stop big losses later — that’s been my rule since 2012 when I first started running spatial workflows on limited budgets.
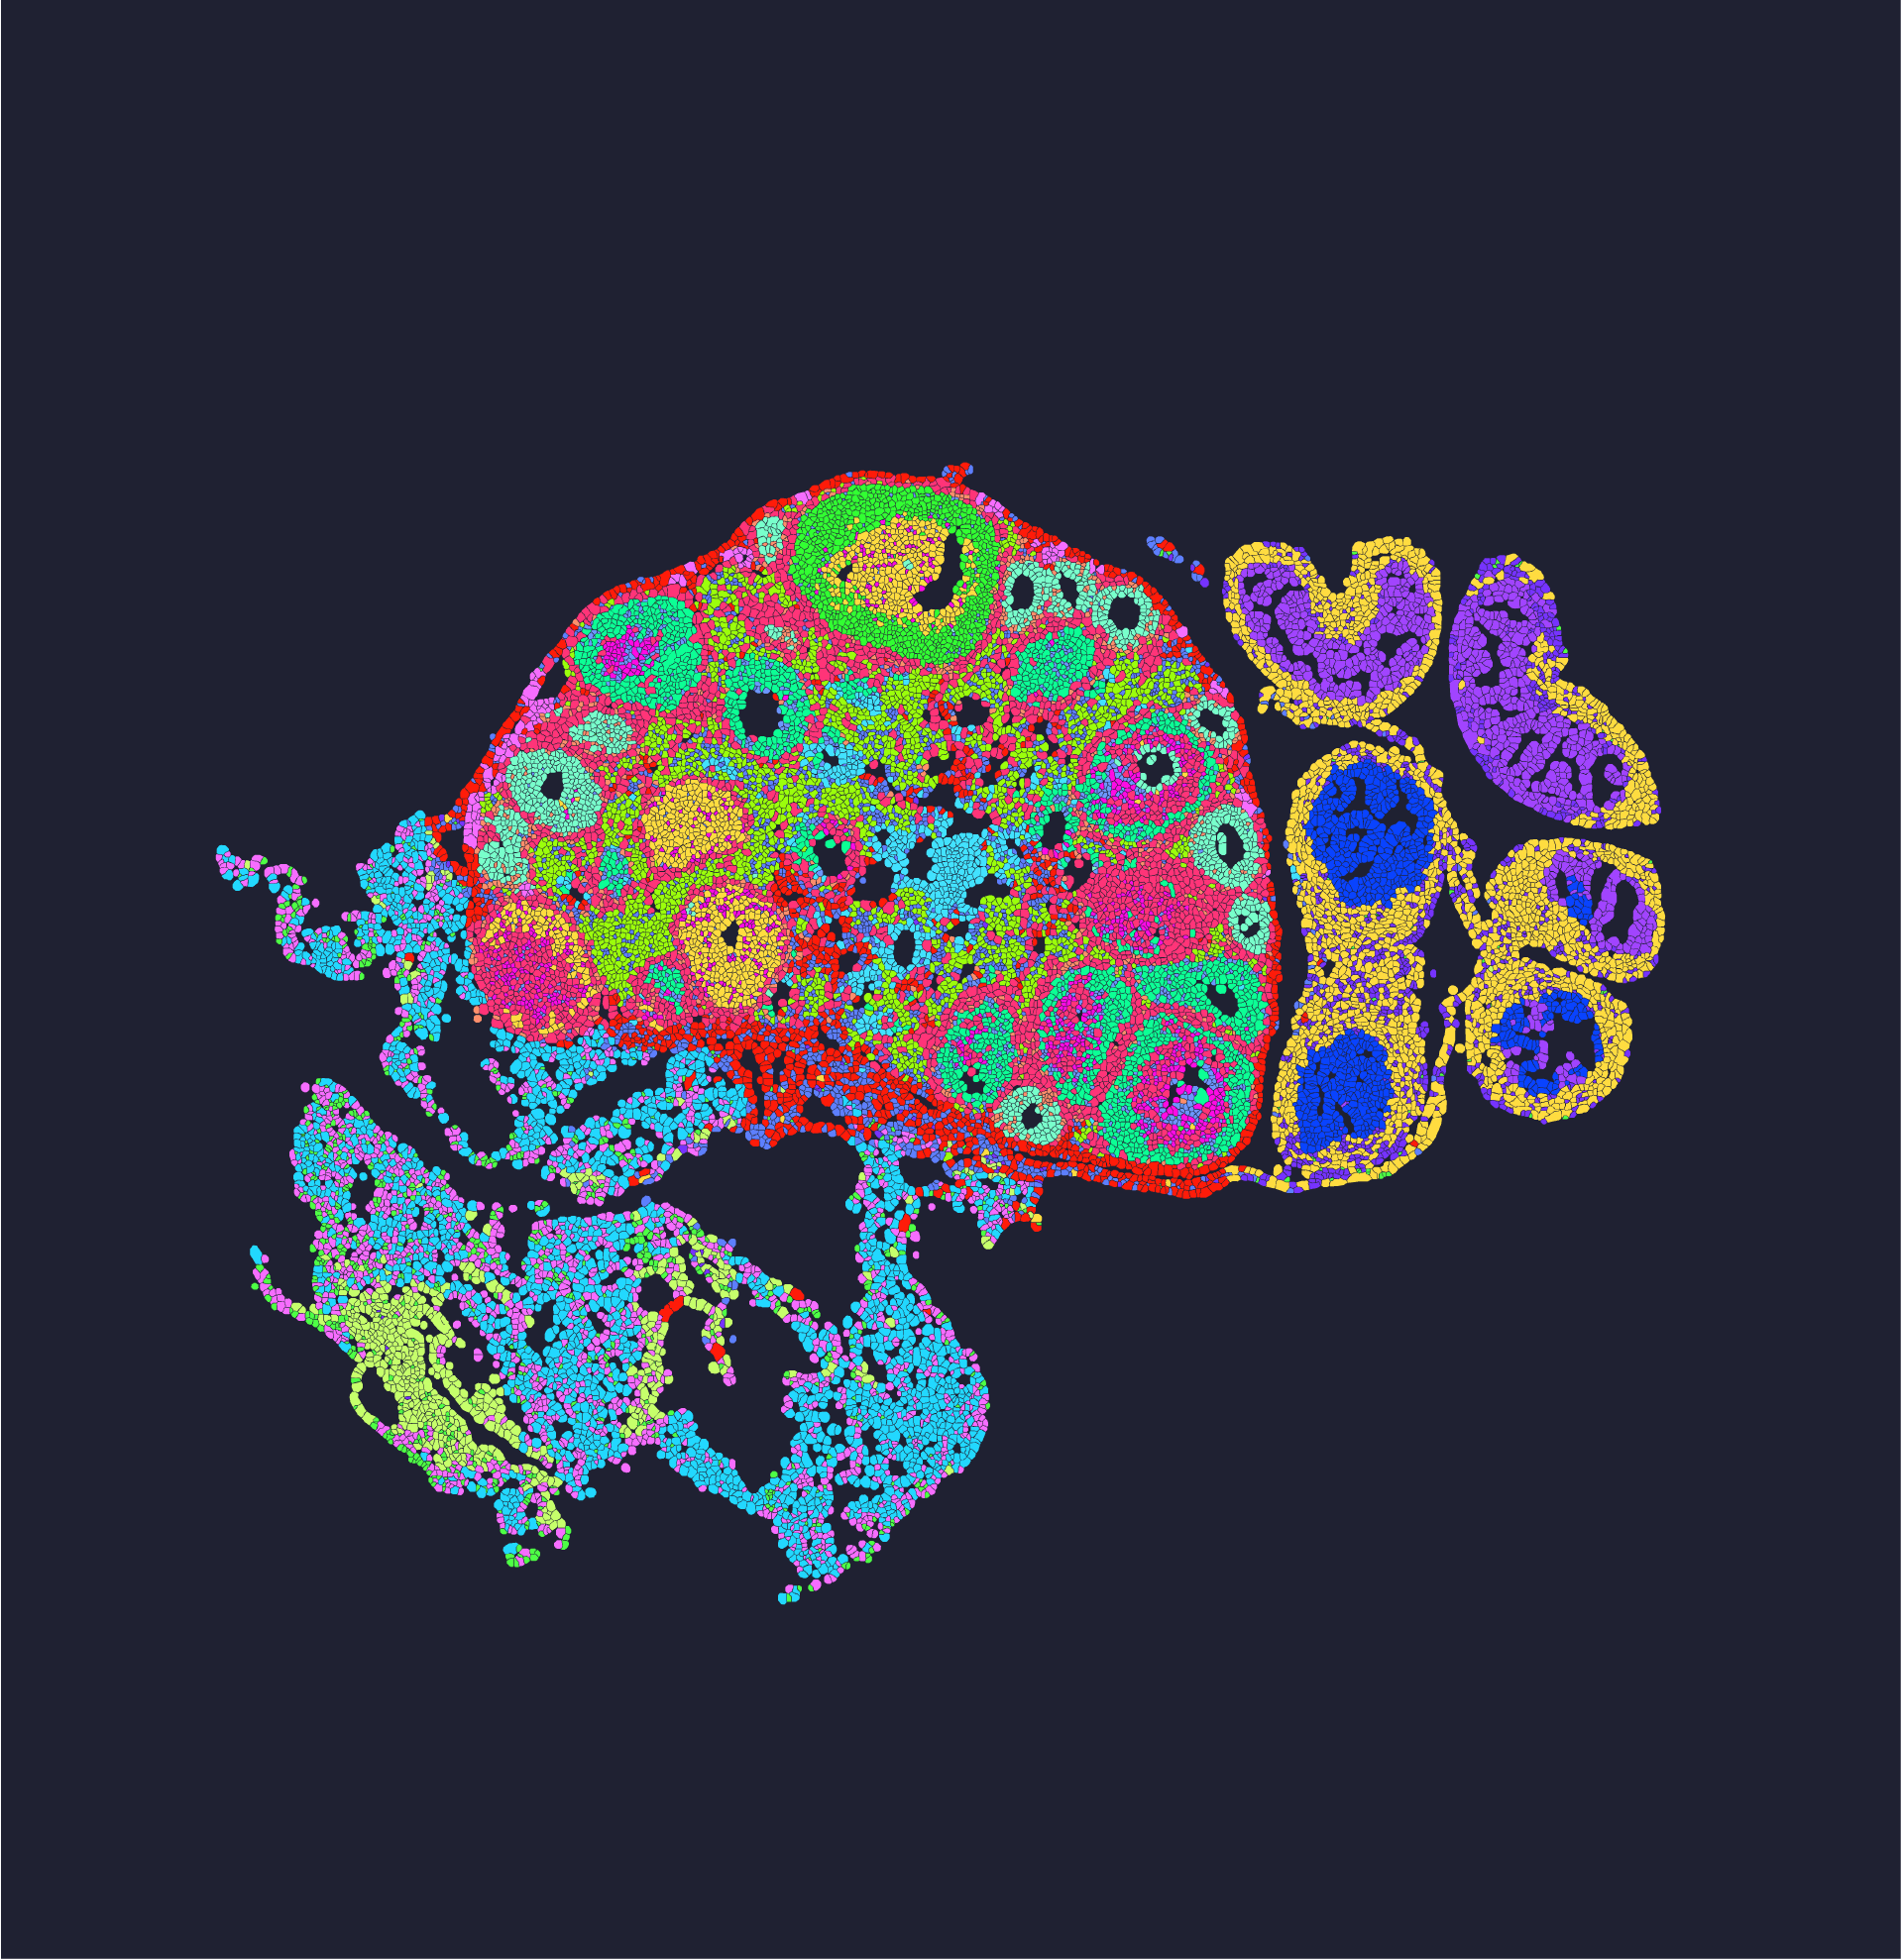
Here are three practical evaluation metrics I use when choosing a spatial transcriptomics solution — use these, test them, and demand the numbers from vendors:- Mapping efficiency (percent reads mapped to spots) — aim for consistent values, not peaks once.- Unique molecular identifier (UMI) retention across the workflow — track loss per step.- Spatial concordance (imaging-to-sequencing registration error in microns) — under 10 µm for high-res needs.
I’ll close with something simple: I believe the labs that win are the ones that log specifics (run dates, kit lots, instrument IDs), test small, and fix the small stuff before it snowballs. You’ll save runs. You’ll save faces. — and yes, we still hustle through setbacks. For practical tools and platform options, check the resources from stomics.